


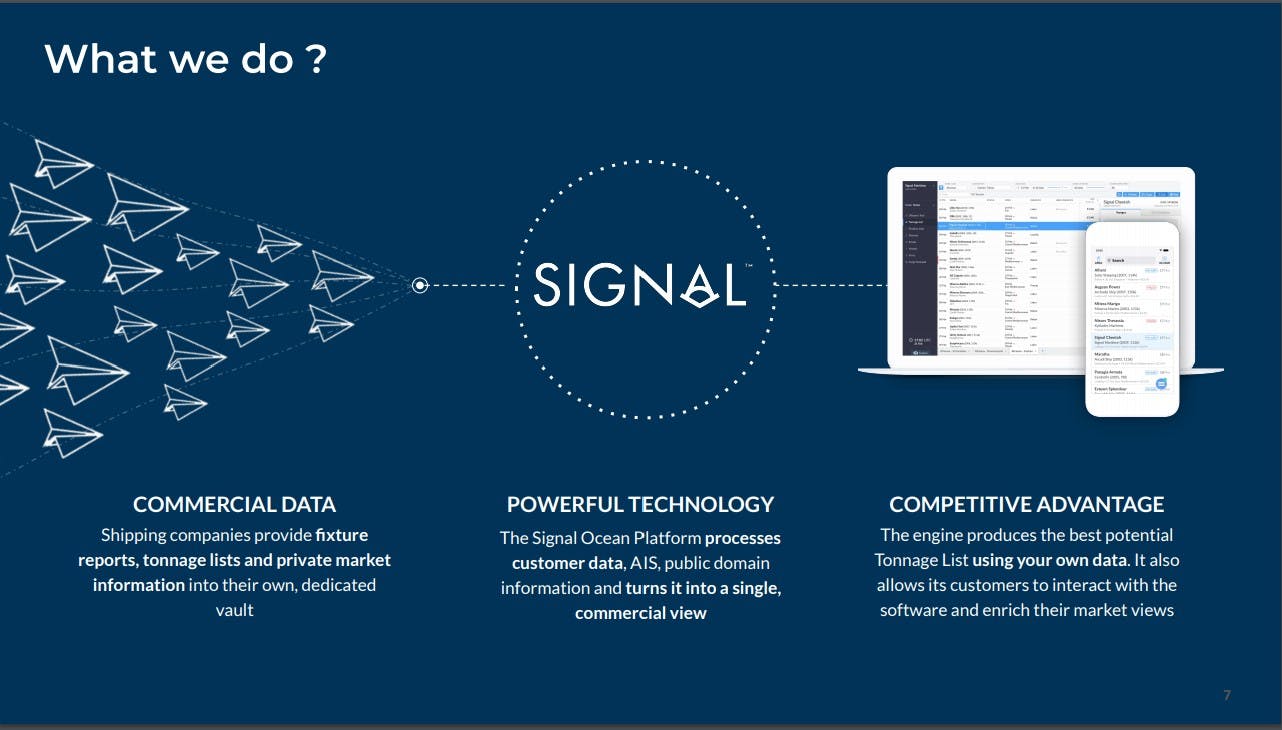
The Signal Group is mainly comprised of two entities, Signal Maritime and Signal Ocean. Signal Maritime is our ship management arm, which currently runs an Aframax pool of about 30 vessels. Signal Ocean is our commercial shipping Software as a Service (SaaS) platform.
In this article, we share how Signal Maritime utilizes the Signal Ocean shipping technology in its day-to-day chartering business to make better commercial decisions and run its tanker pool more efficiently and profitably. The areas that we focus on are: Spot freight market fixing and geographic fleet deployment strategy.
The Signal Ocean chartering platform helps chartering desks on any of the three sides of the fixing triangle – shipbrokers, charterers and commercial operators – while providing each client with a unique view of the market based on their own data. Chartering teams can optimally manage the timing of fixing in volatile markets, the optimal deployment of a vessel or fleet and other commercial decisions.
Challenges in commercial shipping and the role of big data
There are more than 50K commercial vessels on water. Automatic Identification System (AIS) tracking signals are captured every few minutes. As you can imagine, this is already a lot of data about where vessels are going, where they have been, what their speed is and where they are heading to. Then, on the commercial side of things, shipping professionals receive hundreds of emails per day which contain commercial information such as market developments, fixtures, position lists and lineups. The vast amount of shipping data makes it impossible for a human to digest this information daily.
The shipping industry has been relying on inefficient means to process and exchange this type of data such as email, telex and talking over the phone. Not only the information that is out there lacks structure but also it doesn’t come in the same format. Apart from the written information such as emails, there is also a lot of live information. What is not in an e-mail is often circulated by even more unstructured means such as ICE, WhatsApp, Skype and the phone. The Signal Ocean chartering platform processes this commercial data and delivers insights in a more structured way which helps commercial desks know what is happening “now” (now can be a time period of like an hour, or a few minutes or a few hours) in a highly volatile market such as the spot market.
Request a Demo
How Signal Maritime uses the Signal Ocean commercial shipping platform
Monitoring the competition
Spot chartering, especially within the tankers sector, is a very volatile market. One day you might fix a vessel for $10K per day, and the following week, you could fix the same vessel for the same voyage for twice as much. Therefore, it is essential to understand when there is a potential for a cargo to pay more or to pay less. The Signal Ocean chartering platform uses the technology to assess competition for every potential and actual cargo we see in the market. This means having instant, up to date access to how many vessels can compete for the cargo, the firmness of the other positions and their itineraries, as well as the earnings they would potentially achieve from the business.
What has worked for us is the ability to assess competition in real-time, how many vessels can meet the laycan, how many have the right itinerary, the right position, and if they have been to that port before.
Below is an example of a potential cargo and the vessels that at the time could meet the laycan and were commercially available. We observe that one vessel would make $1.5K and another vessel that opens in the Black Sea would make $10.6K. If the vessel that would make the higher time charter equivalent (TCE) is interested in the cargo, she would probably be more competitive.

Fixture timing
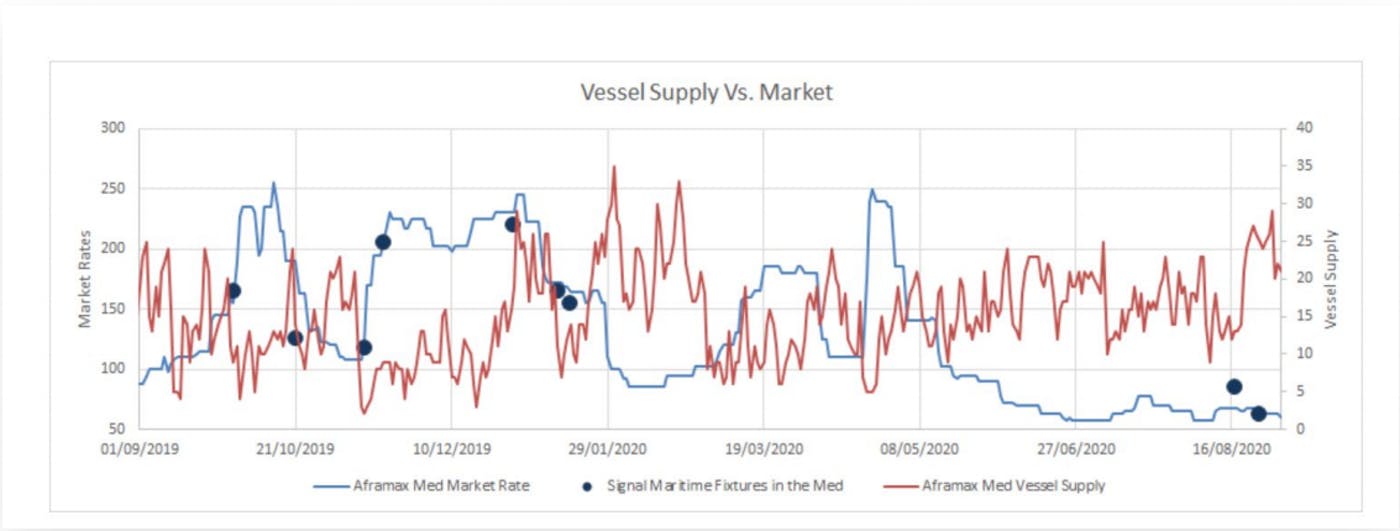
At Signal Maritime we are obsessed with counting ships. The system has helped us develop a firm and quick to update baseline of what it means to have an oversupply versus an undersupply of vessels in the markets we are interested in.
In the graph below, the blue line is the market and the red line is the vessel supply for that corresponding market. Every day we monitor where we are. We take a look at how many vessels are available within the typical fixing window for that specific market (e.g. Aframax in the Med). Are we on the high side? Are we on the low side? Do we see a spike coming? Based on these shipping insights and when it is possible, we adjust our timing in order to fix vessels at the optimum time.
Strategic fleet deployment and benchmarking
Using the Signal Ocean Platform, a company can make strategic decisions regarding the deployment of its fleet, identify optimal trade routes and estimate profits from voyages.
Let’s assume a scenario where a new vessel is joining our pool. She opens in China the following week and we have to find the best employment for her. In order to fix the vessel, we start by looking at the voyages dataset. In the graph below, one can see an aggregated view of all the voyages that have taken place from the start of 2020. Each line represents a loading area and each column represents a discharge area. If we look at the top line, on the second box, we see that since the start of the year, there have been 29 voyages that have loaded in the Arabian Gulf and have discharged in Australia or New Zealand. So, what should we do with a vessel that we have in China? We would focus on the most profitable voyages for vessels that are typically operating in that part of the world.

A difficult problem to solve for any commercial operator is how to account for the optionality that the market provides with voyages of different durations ending up in different discharge areas. To address this problem, the concept of “position value” was designed. Combining many of the core capabilities and data offered by the Signal Ocean chartering platform, this dynamic model allows users to estimate an approximate, real-time TCE offset for any loading area in the world compared to a reference point (e.g. Gibraltar). Using this model, users can, for example, deduce that on a particular day having an Aframax available in Japan is approximately $0.7m worse than having the same vessel in the Baltic.
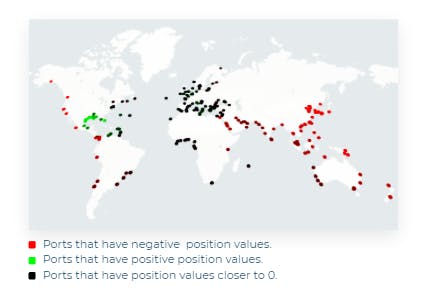
The position value of a port indicates the expected relative profit for a voyage starting from such port. Here we see a variation of positions value by area. These values are used in Signal’s day-to-day estimations to assess the right rate to go East versus the right level to reposition to the USA versus staying in the local market.
Last but not least, accessing easily understood data such as voyages and how people have traded, where they trade, what is their idle time and what is their triangulation time is critical in decision-making. Having a benchmarking tool, helps you to understand what makes sense, to find out who is the best in that market, understand their strategy, and as a result, help you to formulate yours.
The capacity to know through a dynamic analytical calculation how much a vessel is making for every voyage and then, average that by the commercial operator has helped us to understand where we stand in terms of our competition. Analysing our competition, deciding with the help of the forecasting signals and closely working together through the collaboration features of the Signal Ocean platform has helped us find a permanent spot on the top part of that distribution for the last few years.
This case study was also presented during a live webinar with the Baltic Exchange.
